Readers for whom English is not their first language, and indeed for those for whom it is but they are under 40 years of age, may not be familiar with a proverb and an idiom that are both somewhat relevant to the notion of road operators navigating the complex data landscape around accidents.
The proverb “Too many cooks spoil the broth” refers to too many people being involved in a task or activity, virtually guaranteeing that the results will be anything but optimum. In the instance evinced by the proverb, the broth - or soup - has been spoiled by too many extracurricular people adding extemporaneous ingredients.
The idiom “To separate the wheat from the chaff” refers to distinguishing between valuable things (or, indeed people) and those that are less valuable, the “chaff” being the inedible, protective husk that encases the seeds of the cereal (wheat, in the case of the saying).
It’s not too great a stretch to see how the mechanics of the proverb and the idiom can be easily applied to traffic accident data analysis. How many operatives do you need to assess the potential ramifications of a two-vehicle crash on a highway? What is the optimum number? Can too many traffic control centre “cooks” spoil the data “broth”?
And how do you optimally separate the data wheat from the data chaff? Can there be too many layers of data? How do we optimally drill down through the complex strata of road traffic accident information and extract the answers, the patterns and the root causes within seconds?

Peruse Peru’s solution
By way of an example of exactly how to do all that, allow this article to transport you to South America (if you aren’t already there) and to Peru’s capital Lima in particular.
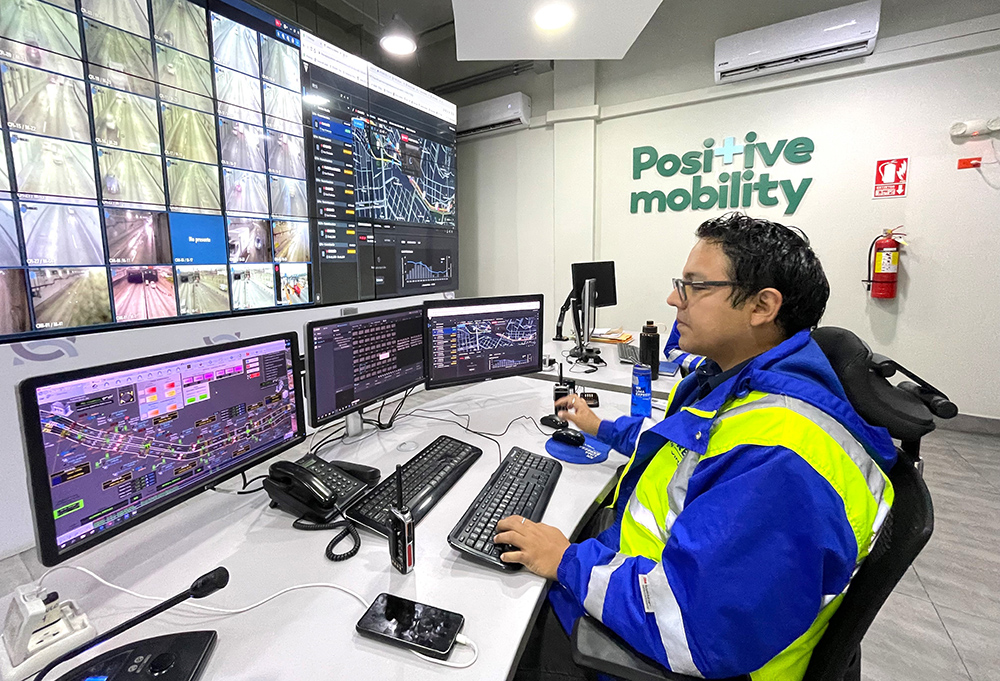
With the goal of improving its road safety record and road management approach, Peru’s Lima Expressa, a Vinci Highways company and the concessionaire of the Vía de Evitamiento and the Línea Amarilla express road, announced the deployment of an automatic accident detection system. The first of its kind in Peru, the system leverages AI and advanced data analytics to improve road safety and increase road operations efficiency. To achieve this, Lima Expressa partnered with UK-based Valerann, one of the global leaders in advanced traffic monitoring solutions to deploy Lanternn by Valerann (LbV).
Among the system’s notable USPs is one outstanding statistic: it detects and classifies over 95% of all road incidents and accidents occurring on Vía de Evitamiento and Vía Expresa Línea Amarilla in less than five minutes.
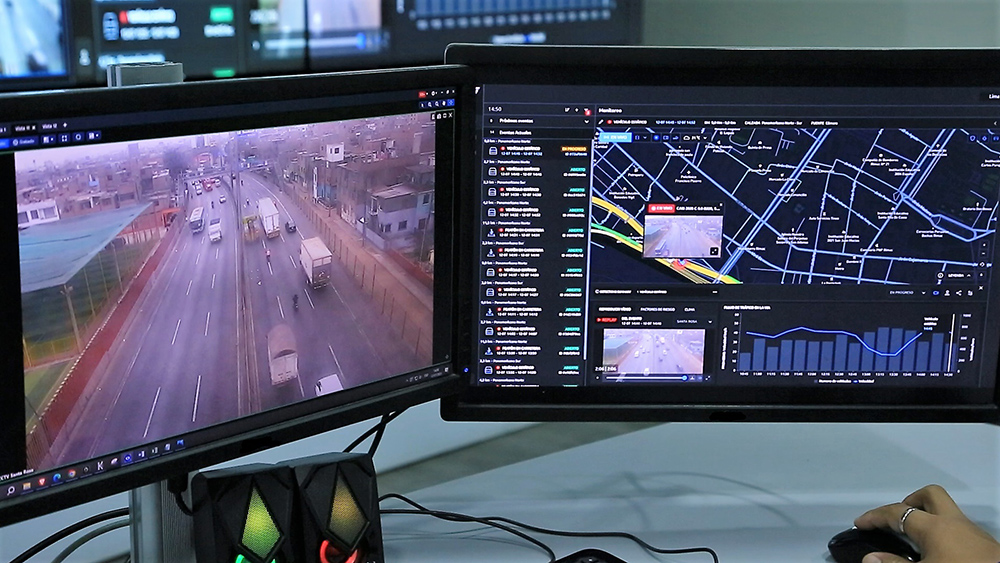
LbV is an AI platform for real-time road traffic monitoring. It is the core of the Lima Expressa’s automatic incident detection system and achieves its world-leading detection rate by ingesting multiple data sources. These include traffic PTZ cameras, roadside infrastructure, crowdsourcing and navigation applications – Waze, Google Maps, Here - detecting anomalies and delivering accurate road traffic information in real time.
So, there you have it. A very happy customer, untold numbers of lives saved and traffic flowing smoothly in the centre of a megapolis with nine million inhabitants
LbV removes road authorities’ reliance on manual event verification by detecting and identifying road incidents while at the same time providing information on the exact incident’s location, cause and severity.
Further enhancing its road safety capabilities, the system facilitates preventative measures for road accident management by rapidly detecting pedestrians and stopped vehicles in potentially dangerous zones.
So, there you have it. A very happy customer, untold numbers of lives saved and traffic flowing smoothly in the centre of a megapolis with nine million inhabitants. That’s great. But – and this is perhaps the all-important question – how does cross-data fusion work? How does this system identify and detect incidents and accidents so quickly? How are traffic, infrastructure, resources and weather unified, analysed and contextualised? What is cross-data fusion? And how did we get here? Welcome to the what, when, now, why and where of events.
Empowering road operators through data
Valerann’s Data Fusion Engine essentially performs four tasks, concurrently. It fuses previously unwieldy volumes of data into actionable events; it harmonises unstructured data into a single harmonised view; it combines multiple sources of partial data into one single source of complete data; and it removes uncertainty by validating the data with traffic, risk and weather context.
Data Fusion combines the best of all possible data worlds: whereas other methods of data collection (such as IoT sensors and machine vision) each tick some of the must-have data requirement boxes (namely coverage, vehicle percentage, richness, robustness, accuracy and latency), Data Fusion can do it all and in a fraction of the time. This is borne out by the inarguable statistics of an 93% improvement in response relevance and a 25% in response time.
The core of this highly innovative solution is a holistic real-time picture of road traffic situation, real-time accidents risk prediction and a list of ranked and prioritised events with relevant information that enable operators to action upon. When the operator selects ‘Events’, they get data that is contextualised against traffic infrastructure resources and weather information that they have at their disposal. LbV has the answer to any question that needs to be asked about the event.
What's happening? When did it happen? How did it unfold? Why was there congestion? Was there a pedestrian on the highway? What and where is the source of the problem? Where's the effect of the problem?
So how do we get to the point where we have such rich information about things that are happening on the road? The answer to that question, at least, is cross-data fusion, the result of many years of laser-focused, specific R&D that saw Valerann’s data scientists navigate complex landscapes of data around events that are happening on the road.

Thereby hangs the tale
How the data is collected in the first place is a matchless mix of “same source, different type”, “same type, different source” and “different source, different type”. And that is what the notion of cross-source, cross-type, deep-data fusion boils down to – the smelting together of seemingly disparate, separate data.
In a typical incident (if such a thing exists), congestion information is received before accident information. By fusing different sources and different types of information together, operatives can start to piece together the genesis of the accident. Also, the impact of the accident can be pinpointed exactly, such as which carriageway is predominantly affected directionally. Valerann sees the structural and chronological history of an accident as telling a powerful story.
In terms of the cross-source aspect information is pulled from other data sources, such as Google, loops and cameras, all of which act as sensors. These are completely independent, different data sources, but they are compiled onto the same coordinate system to paint one single picture.
Disparate data sources they may be (including even third-party weather information), but fused together they provide a single answer to every question about an event or accident: When did it start? How did it start? Which carriageway was originally affected and which carriageway is affected now? Traffic managers are in need to significantly increase their levels of situational awareness in their daily operations – and cross-fusion, multi-sourced traffic data provides exactly what is required.
The bigger picture that this ingenious solution paints is further ameliorated by the inclusion of a risk layer that highlights pertinent historical patterns of what happened on the road. If, historically, there's a trend of accidents happening at a particular bend, there is therefore an elevated accident risk. If the data suggests that there has been an accident, the system’s core competency means that TMC staff can be confident that there has genuinely been an accident. This is the cross-fusion interplay between historical data as a source and real-time data as a source.
As an example, where Waze provides some third party data sources, Valerann’s data scientists can build a contextualised risk model around it, constructed from information that has come from various data sources to support the decision–making process. An accident where there has been a 50/50 split between information coming from cameras on the road and information from connected vehicles there is, in effect, double the amount of detection information from these two data sources, rather than half from each.
Blessings, curses and rising to the challenge
In Valerann’s worldview, when it comes to hyper-effectively managing a road network using traffic data, there are four main challenges. The first challenge is related to the sheer amount of information that is instantly available at the fingertips of a traffic control centre’s staff.
Big data is both a blessing, because there's so much information available, and a curse… also because there's so much information available. However, this information overload inevitably leads to alert fatigue for the road operator – the potential consequences of an overloaded, overwhelmed operator are all too obvious.
“The only approach to this is to recognise that things are imperfect and that data is noisy, so the only true solution is combine the best of everything”
The data challenge is related to the fact that all this data comes in different shapes and sizes. Social media-sourced traffic data is often unstructured and lacking in uniformity in the form of WhatsApp messages or SMS. Telephone calls’ unstructured audio is also a challenge to consume, whereas connected vehicles provide trajectory information and machine vision-sourced data can only offer object detection or images. Individually and collectively the data provided by these disparate sources have their merits, but how does an operator start to reconcile and validate it all? To validate and reconcile this type of data requires expert knowledge of the process and even the experts take time to piece together all the separate fragments of information to form a coherent picture.
The third challenge pertains to the notion of partial data. A pertinent example of this would be where a vehicle can only see what's immediately around it. It can see a traffic jam, but it can't see the cause of the traffic jam. The issue here is that if you only have partial information, you don't have the full picture. With “noisy” data a connected vehicle can make an incorrect assessment about its surroundings that can, in the worst-case scenario, lead to a serious incident or accident. These are very real data challenges and very real problems that road operators face. This is what Valerann refer to as the “trust gap” and where deep data fusion is an answer to bridging it.
“We bridge this trust gap by addressing these problems and, philosophically speaking, recognising that data is noisy and data sources are imperfect,” says Valerann co-founder and CBO Michael Vardi. “There maybe some other companies in this industry sector that might claim that they have this ‘golden’ approach to solving measurement conundrums using Lidar, radar and so on. However, our experience and our thinking is that there is no ‘silver bullet’. The only approach to this is to recognise that things are imperfect and that data is noisy, so the only true solution is combine the best of everything.”
When what could otherwise be a foreboding tsunami of data is fused together, the picture that is gleaned from it is actionable, relevant and complete. As Aristotle so eloquently put it 2,370 years ago, the whole is greater than the sum of its parts – and the data wheat is expertly separated from the chaff.
As for the aforementioned broth, with the optimum number of ‘cooks’ at the cross-fusion ‘stove’ the results are eminently digestible.
Content produced in association with Valerann


