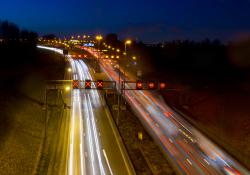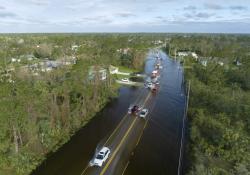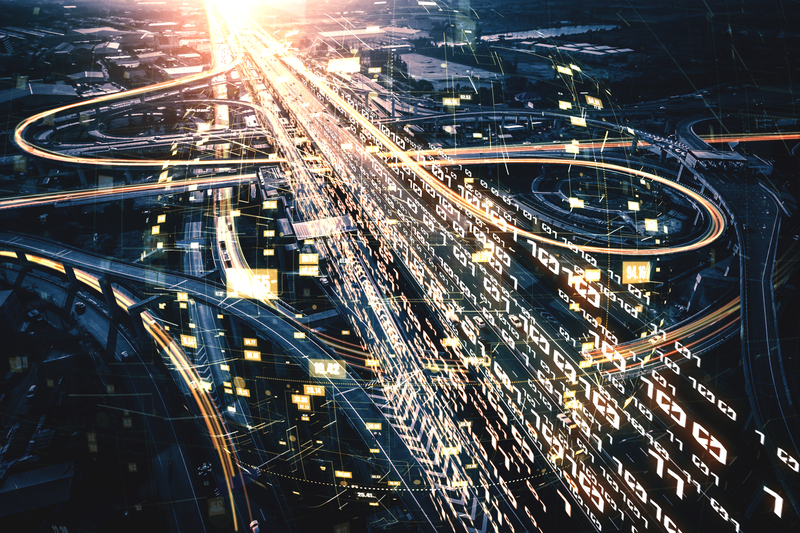
At Valerann, we provide monitoring and management technologies for motorways, including Israeli’s busiest motorway; Ayalon. With 860,000 AADV (annual average daily traffic), the road is in intensive use 24/7, 364 days a year. However, on Yom Kippur, the Jewish Day of Atonement and the holiest of all holidays, people are prohibited from engaging in all forms of work, effort, or activity. This includes driving. In Israel, where most of the population is Jewish, it makes for a very special day. For 24 hours all the roads are empty. Bustling high streets fall silent, massive motorways run dry, and the roads fill with people just walking on the asphalt. This makes for interesting pictures and unexpected behaviour for traffic data.
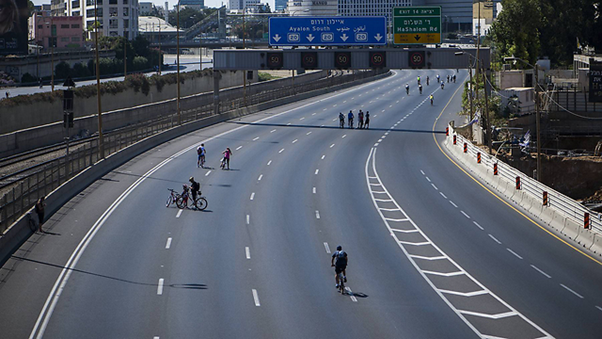
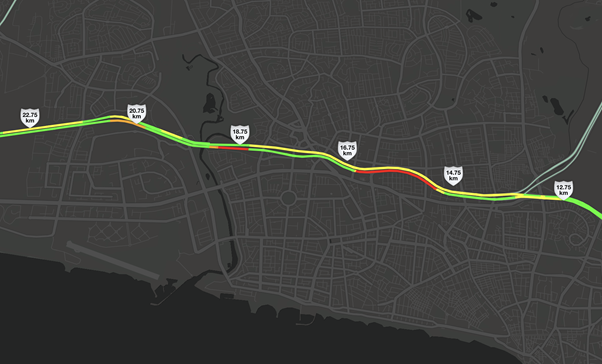
Unexpectedly, when we looked at the data on Yom Kippur we were getting from Google Maps, it seemed like the majority of the Ayalon motorway was filled with vehicles crawling along. The entire map was glowing bright red with carriageways that were supposedly filled to the brim with slow-moving vehicular traffic.
How was this possible?
Well, while there were no vehicles on the road, there were cyclists (and pedestrians and potentially people having a picnic on the motorway)! These cyclists were carrying their cell phones along, which were confusing google maps into believing vehicular traffic existed and that it was driving slowly. This is quite reminiscent of the artist who brought a road network to a standstill by wheeling 30 cell phones across a major bridge, fooling Google into re-routing all traffic through alternative roads.
When comparing this data from in-road sensors we integrated and our machine vision capabilities, it was clear that the road was indeed empty. Had we not had these alternative sources of data, we could have wrongly concluded there was a traffic jam. Of course, floating car data is known to not be perfect. However, it is not the only case where a single source of data can mislead
For instance, while road operators use cameras extensively, their limited line of sight means that they often mislead.
A control centre operative who sees a traffic jam, may miss the accident upstream that caused it. Or sensors that measure traffic flow based on headway, may misclassify a stand-still as a vacant road, as there will be a long pause between vehicles going over the sensor. It can happen that a radar looking to detect stopped vehicles will suffer from shadowing and blind spots caused by other vehicles and its own range.
In addition to the inherent shortcomings of each individual data source, there are also practical limitations.
Deploying, and maintaining cameras and radars is prohibitively expensive and can rarely be used to provide full cover sufficient for automated detection. It is practically impossible if roads wish to have the redundancy necessary for mission critical infrastructure.
Connected vehicle can provide information from the full road, but the data is noisy and susceptible to errors. One accident can be reported 10 times by Waze users, often with a delay. And a stopped vehicle in one road will be reported in the next road by users who took a few seconds to report the incident.
Lastly, even if the data from the road was perfect, accessing this information alone is not enough. The data needs to be provided within context and augmented with additional information critical to decision making such as location and status of patrol vehicles; location and status of VMS signs; weather and visibility on site of incident; or what road works and infrastructure are at the location of the incident.
Effective data fusion increases certainty, expedites response, and ensures safer resolution. It allows the operator to instantly consume all the data that is relevant for the decision she or he need to make. This allows the operator to enjoy the strengths of each individual data source, while reducing the inherent drawbacks.
For example, a couple of months ago Valerann detected a major accident through Waze. This provided us with a location and time when this incident was reported and supposedly took place. However, like this incident, Valerann receives hundreds of events per day from Waze, many being false alerts. So, to increase the certainty from the incident, Valerann located the nearest video camera and was able to automatically identify a stopped vehicle under a bridge. However, the accident itself was obstructed by the bridge.
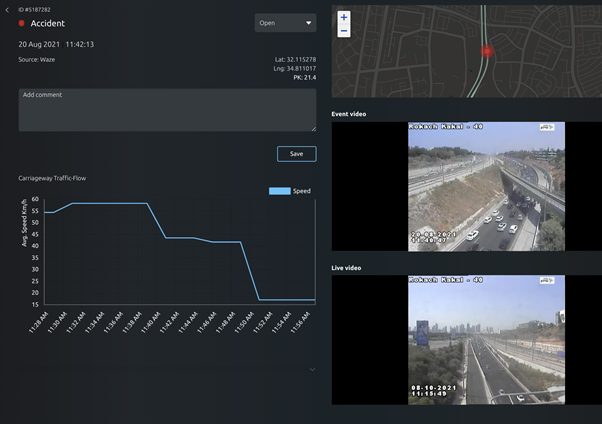
So, Valerann’s system automatically called for traffic flow data from sensors. As the sensors were not near enough to the location of the crash, we leveraged speed data from connected vehicles and were able to clearly see that traffic flow was massively slowing down exactly at this location. This all happened automatically and provided us enough certainty to require an immediate response to an accident detected by Valerann through Waze, corroborated with video analytics and confirmed with traffic flow data from connected vehicles.
This example shows the strength that proper data fusion provides operators in life-or-death situations and how it can allow us to react fast, reduce risks, and decrease bottle necks. It is also critical to enable road operators to do effective post-mortems: why did the event happen? What was the context? And help us continuously improve towards reduced congestion, lower emissions, and Vision Zero.
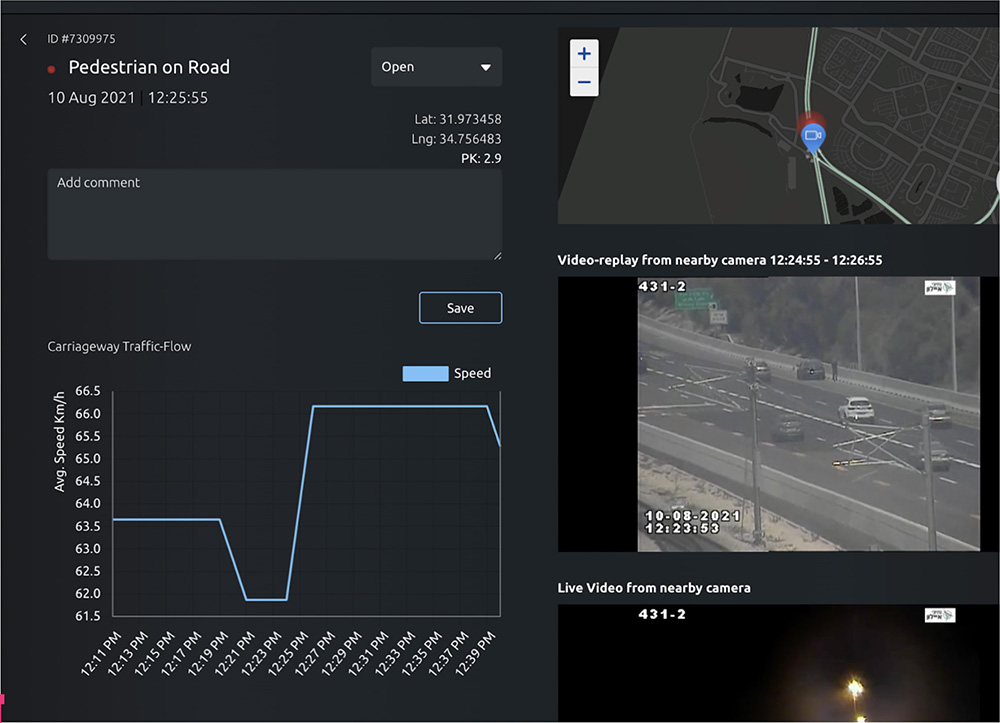
For example, Valerann fused data from vehicle dashcams (GDPR-compliant) to help identify risks that were not captured by stationary cameras and open sources. Through this, we were able to locate hot spots of where many pedestrians were walking along a very busy motorway. Fortunately, these pedestrians did not stay in the motorway for long enough to allow the operator to respond in real time.
Thankfully, through Valerann’s fusion we were able to understand why pedestrians were using the road. Fusing the data from the vehicles with data from roadside cameras, we were able to discern that, often, pedestrians were on the road because they would be dropped off by drivers just after a motorway exit. The pedestrians would then cross the exit on foot, jump over the safety barrier, in order to take a shortcut to a nearby destination.
While this was too quick for patrol response, it allowed the operator to deploy preventative actions, by placing patrols more effectively and by putting additional barriers preventing pedestrians from using the motorway as a thoroughfare.
Data fusion helps operators get the most of their data, while reducing the susceptibility of each data set to error. It allows us to increase the certainty we have and react faster and more relevantly to risk events. Data fusion is in the heart of what Lanternn by Valerann does.
 To learn more about how to better leverage your existing data to make your operations safer, faster, and more economic, please do not hesitate to contact us.
ABOUT THE AUTHOR:
Michael Vardi is co-founder and CBO of Valerann
Sponsored content produced in association with Valerann


